
The BCG Matrix: How to Prioritize Products Like an MBA
Jul 01, 2025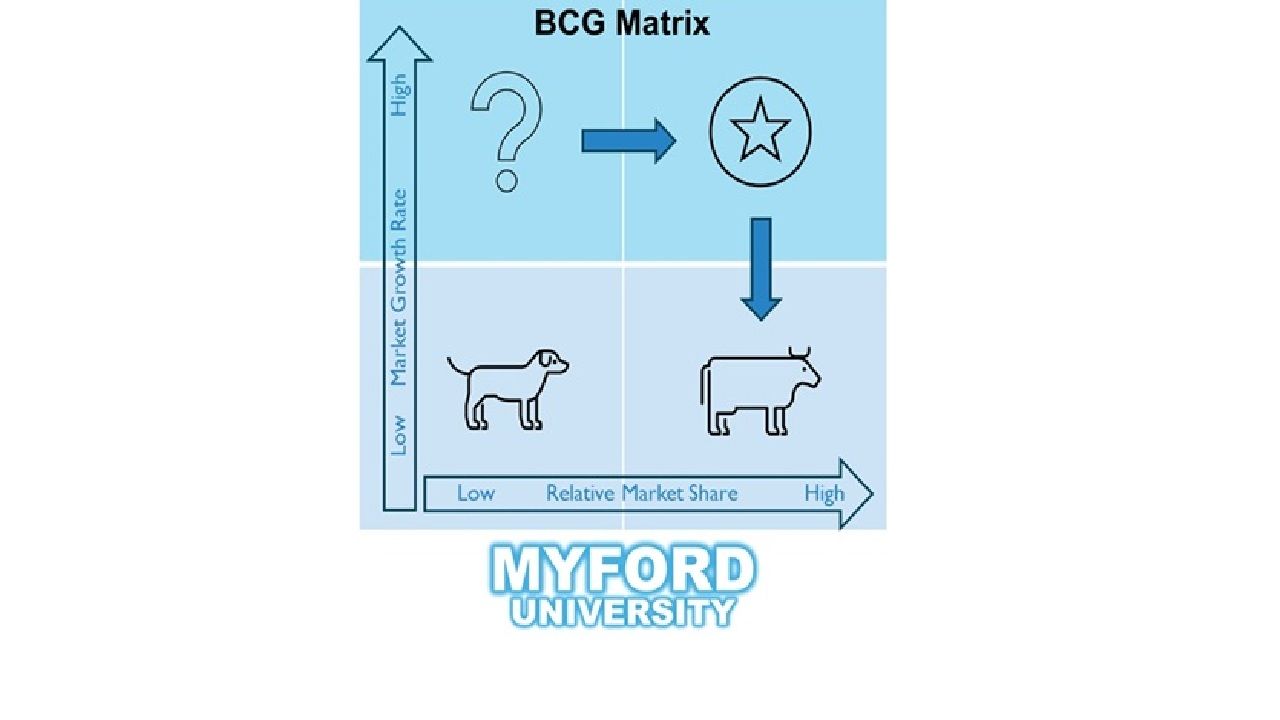
When it comes to making strategic business decisions, one of the biggest challenges is figuring out where to focus your time, energy, and money.
What should you double down on?
What should you fix, hold, or walk away from?
That’s where one of the simplest—and most powerful—MBA tools comes in:
The BCG Matrix.
Also called the Growth-Share Matrix, it was created by the Boston Consulting Group to help leaders analyze product lines and business units—quickly, visually, and strategically.
It’s the kind of tool they teach in business school—but it’s just as valuable in small businesses, side hustles, nonprofits, and even personal decision-making.
In this article, I’ll show you what the BCG Matrix is, why it matters, how to use it, when to use it, and give you examples of how it works in both big business and small.
You don’t need an MBA to think like one. You just need the right tools—and this is one of them.
What Is the BCG Matrix?
The BCG Matrix is a simple 2x2 grid that helps you categorize your products, services, or business units based on two key factors:
- Market Growth Rate – How fast the market is growing
- Market Share – Your share of that market compared to competitors
Those two dimensions give you four quadrants:
- Stars – High growth, high market share
- Cash Cows – Low growth, high market share
- Question Marks – High growth, low market share
- Dogs – Low growth, low market share
Each one suggests a different strategy—invest, harvest, grow, or divest.
It’s simple. Visual. Strategic. And shockingly useful.
Why the BCG Matrix Matters
Here’s the problem: most businesses spread their resources too thin.
They try to grow everything at once. They hold on to underperformers. They miss chances to scale what’s already working.
The BCG Matrix helps you:
- Make data-driven resource allocation decisions
- Identify products to invest in—and ones to let go
- Balance your portfolio between growth and profitability
- See at a glance what’s helping you—and what’s holding you back
Whether you’re running a multi-product company or just managing your own offerings, this tool brings clarity.
The Four Quadrants Explained
Let’s take a closer look at each quadrant—what it means, and how to act on it.
- Stars – High Growth, High Market Share
These are your future leaders.
Stars are in fast-growing markets and you have a strong position. They usually require investment to fuel that growth—but if nurtured, they can become your next Cash Cows.
Strategy:
- Keep investing
- Scale operations
- Improve efficiency
- Defend market share
Example:
Think iPhone during its rapid rise. High demand, dominant share, and worthy of massive R&D spend.
- Cash Cows – Low Growth, High Market Share
These are your profit engines.
Cash Cows are in mature markets with limited growth—but you dominate. They generate steady cash flow with lower investment needs.
Strategy:
- Maximize profits
- Maintain market share
- Avoid over-investing
- Use profits to fund Stars and Question Marks
Example:
Coca-Cola Classic. Soda growth is flat, but it owns shelf space worldwide. It's a cash machine.
- Question Marks – High Growth, Low Market Share
These are your wild cards.
Question Marks are in booming markets—but you’re not a leader. They require a decision: Do you invest to become a Star? Or cut your losses?
Strategy:
- Evaluate potential
- Test and validate
- Invest selectively
- Kill quickly if it’s not working
Example:
A new product category you entered late—big upside, but low presence.
- Dogs – Low Growth, Low Market Share
These are your laggards.
Dogs are in stagnant markets and have weak positions. They eat up time and money—but offer little in return.
Strategy:
- Phase out
- Sell or shut down
- Avoid emotional attachment
- Free up resources
Example:
Legacy products that still exist out of habit, not performance.
How to Build a BCG Matrix for Your Business
Here’s a step-by-step approach:
🔹 Step 1: List Your Products or Units
This could be:
- Product lines
- Service offerings
- Business segments
- Even marketing campaigns
🔹 Step 2: Determine Market Growth Rate
Look at industry trends. Use market research, third-party reports, or Google Trends. Is the market growing fast, slow, or not at all?
High growth = >10%
Low growth = <5%
🔹 Step 3: Determine Relative Market Share
This is your share vs. your biggest competitor. A relative share >1 means you’re a leader. <1 means you’re not.
🔹 Step 4: Plot Each Product on the Matrix
Place each item based on its position.
🔹 Step 5: Analyze and Decide
- Invest in Stars
- Maintain and profit from Cash Cows
- Evaluate and test Question Marks
- Exit Dogs
Real-World Example: Small Business Application
Let’s say you run a consulting business with four offers:
- Strategy Intensive Workshops
- Monthly Retainer Clients
- Online Courses
- Printed Workbooks
You assess growth and share:
- Workshops: High growth, high share → Star
- Retainers: Low growth, high share → Cash Cow
- Courses: High growth, low share → Question Mark
- Workbooks: Low growth, low share → Dog
Your decisions:
- Invest in workshops (scale, hire, automate)
- Keep retainers (steady income)
- Test and improve course funnel
- Discontinue workbooks or make them free lead magnets
This is strategy in action.
When to Use the BCG Matrix
Use it when:
- Your product list is getting too long
- Resources are limited
- You’re considering cuts or investments
- You’re planning a strategy or annual review
- You feel stretched but can’t see what to drop
It’s a great tool for quarterly reviews, product audits, or growth planning.
Common Mistakes to Avoid
🔻 Overvaluing legacy products
Just because you’ve always offered it doesn’t mean you should keep it. Sentiment isn’t strategy.
🔻 Using gut instinct instead of data
You need real numbers—market size, customer demand, share estimates—not just hunches.
🔻 Trying to grow everything
Resources are finite. You can’t scale 10 things at once. The matrix forces focus.
🔻 Misreading Question Marks
Not all of them deserve your energy. Be ruthless in your analysis.
BCG Matrix vs Other Tools
How does this compare to other strategy tools?
- SWOT Analysis helps you evaluate strengths, weaknesses, opportunities, and threats—but it doesn’t tell you what to do.
- Ansoff Matrix helps you think about market vs product innovation—but it’s more directional.
- BCG Matrix gives you a portfolio view—what to bet on, milk, test, or cut.
It’s fast. Visual. Actionable. That’s why MBAs use it—and why you should too.
Closing Thoughts: Think Like a Capital Allocator
The real purpose of the BCG Matrix isn’t to look smart.
It’s to make smarter decisions.
It helps you stop guessing and start allocating your time, money, and focus where it actually counts.
If you’re an entrepreneur, small business owner, corporate leader, or even a solopreneur with three offers, this tool helps you stop treating every product equally—and start playing to win.
Because in business, you don’t get paid to do everything.
You get paid to do the right things, in the right order, at the right time.
And that starts by asking:
- What’s my Star?
- What’s my Cash Cow?
- What’s my Question Mark?
- What’s my Dog?
Figure that out—and your next move becomes obvious.
Stay connected with news and updates!
Join our mailing list to receive the latest news and updates from our team.
Don't worry, your information will not be shared.
We hate SPAM. We will never sell your information, for any reason.
